
A New Era of RNA-Seq Data Analysis
Analyze transcriptomic data for free on your own laptop. No coding required, total privacy, and publication-ready visualizations in minutes.
Global Community
Trusted Worldwide
Join researchers all around the world using Jetomics.
Privacy First
Why researchers choose Jetomics
Bioinformatics should not require compromising privacy or waiting in cloud queues.
Your data never leaves your computer. We function mostly offline, ensuring your proprietary genomic data remains yours.
Forget about server queues or requesting demo access. Download the app and start analyzing immediately on your own hardware.
No R, Python, and command line tools are required. We wrap powerful packages into an intuitive desktop experience designed for biologists, onclogists, and bioinformaticians in a hurry.
Complete Pipeline
Bulk RNA-Seq Analysis
From raw counts to publication figures. We have grouped all the powerful features you need into a seamless workflow.
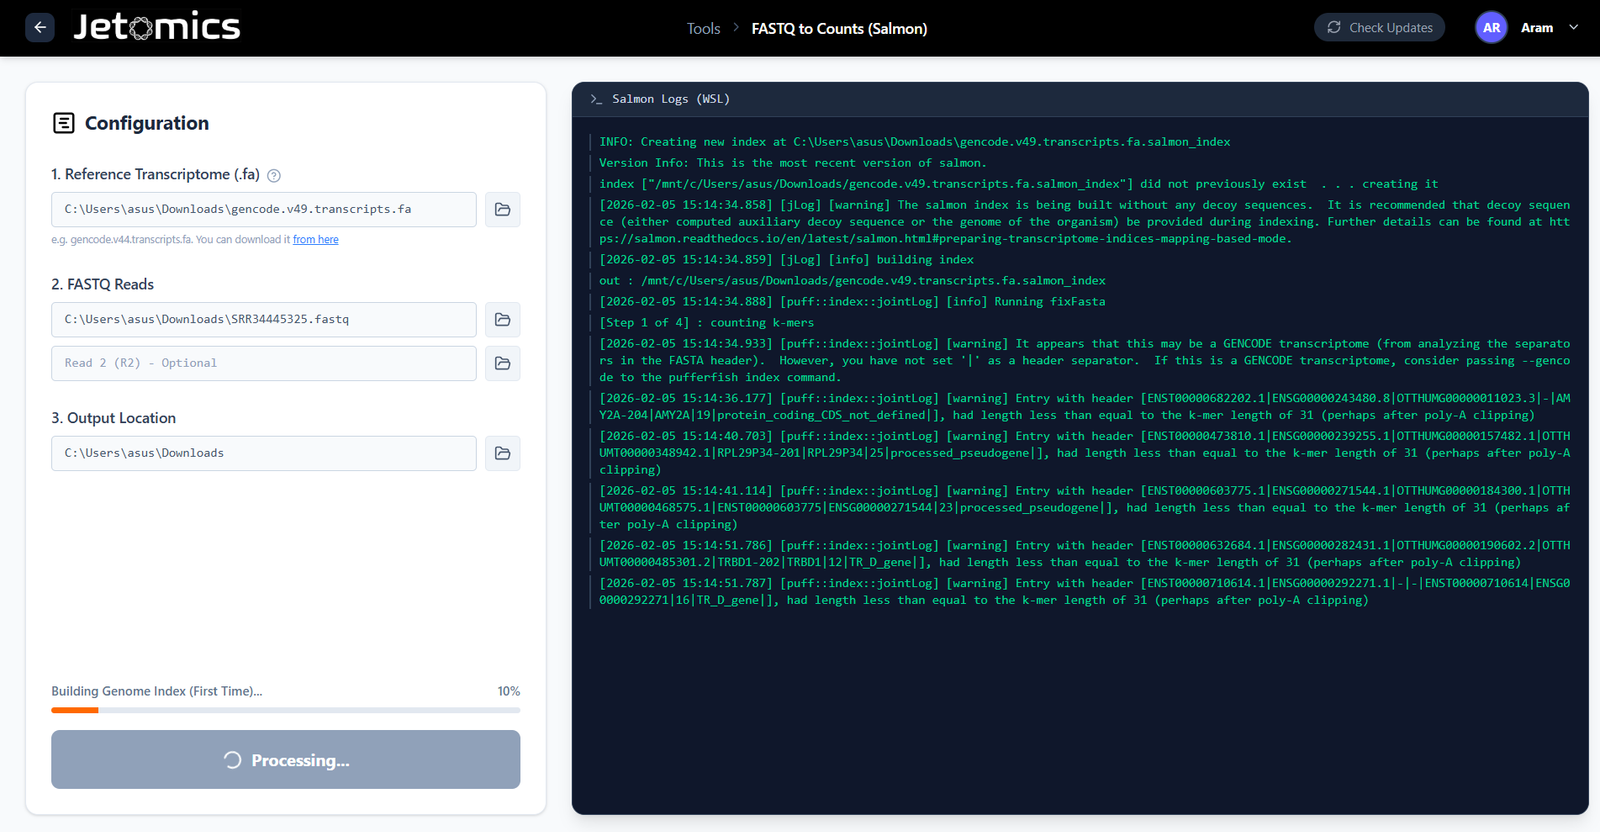
Fast Pseudoalignment
Bypass the need for large alignment files. Quantify transcript abundance in minutes using the integrated Salmon engine.
- Local Execution: Run Salmon locally on your machine with optimized multi-threading.
- Transcriptome Indexing: Easily import indices for human, mouse, or custom genomes.
- Lightweight: Drastically reduce storage requirements compared to BAM/SAM files.
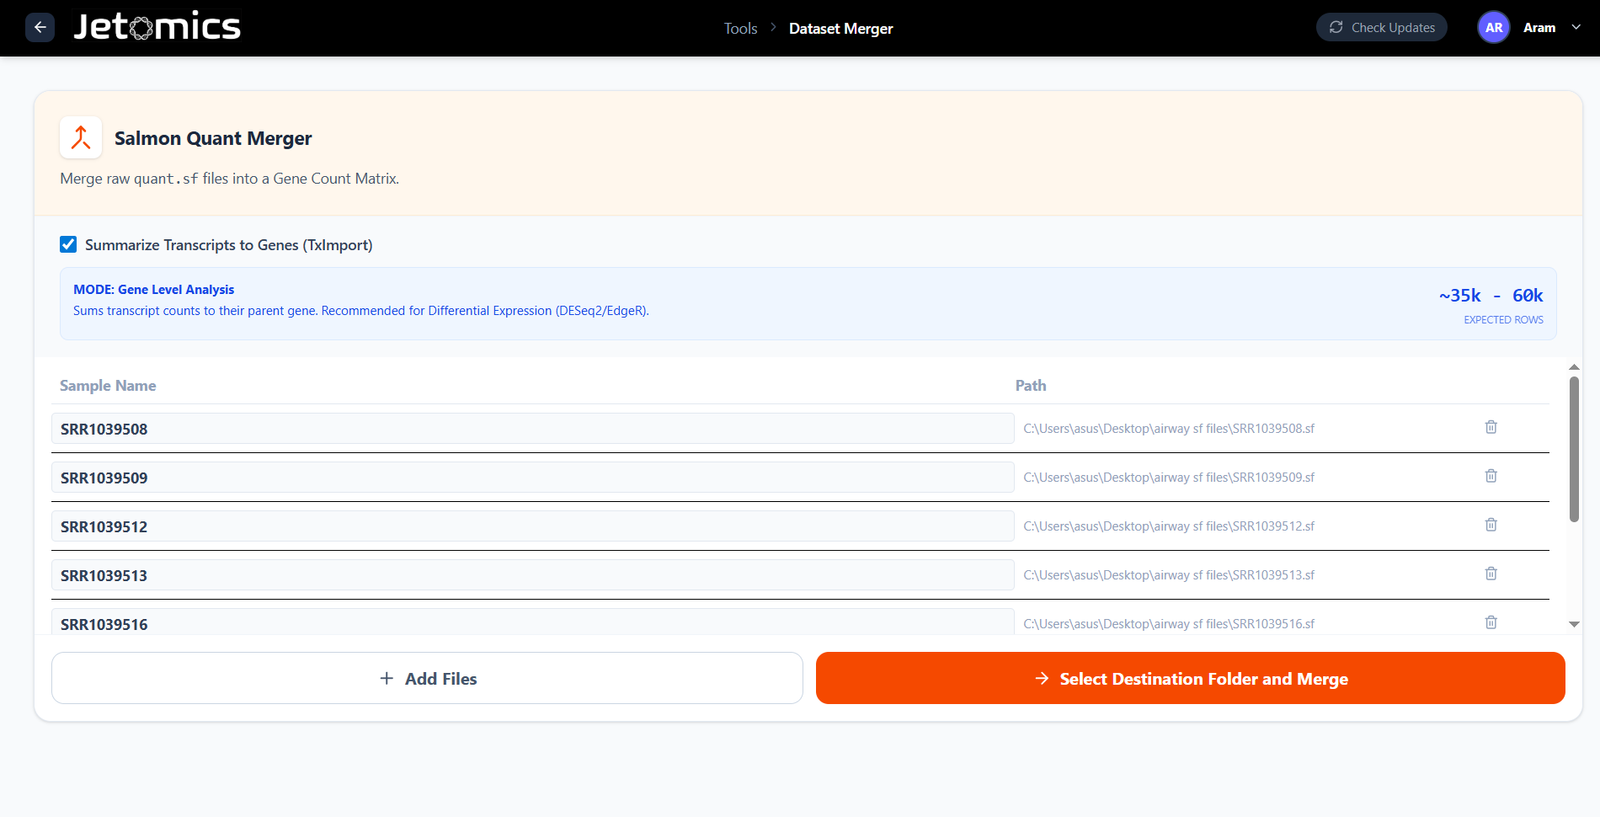
Seamless Data Integration
Combine quantification files effortlessly. Whether you have 5 samples or 100+, merge them into a unified matrix instantly.
- TXimport Integration: Automatically summarize transcript-level counts to gene-level counts using standard libraries.
- Raw .sf Merging: Merge raw Salmon output files directly if you prefer transcript-level analysis.
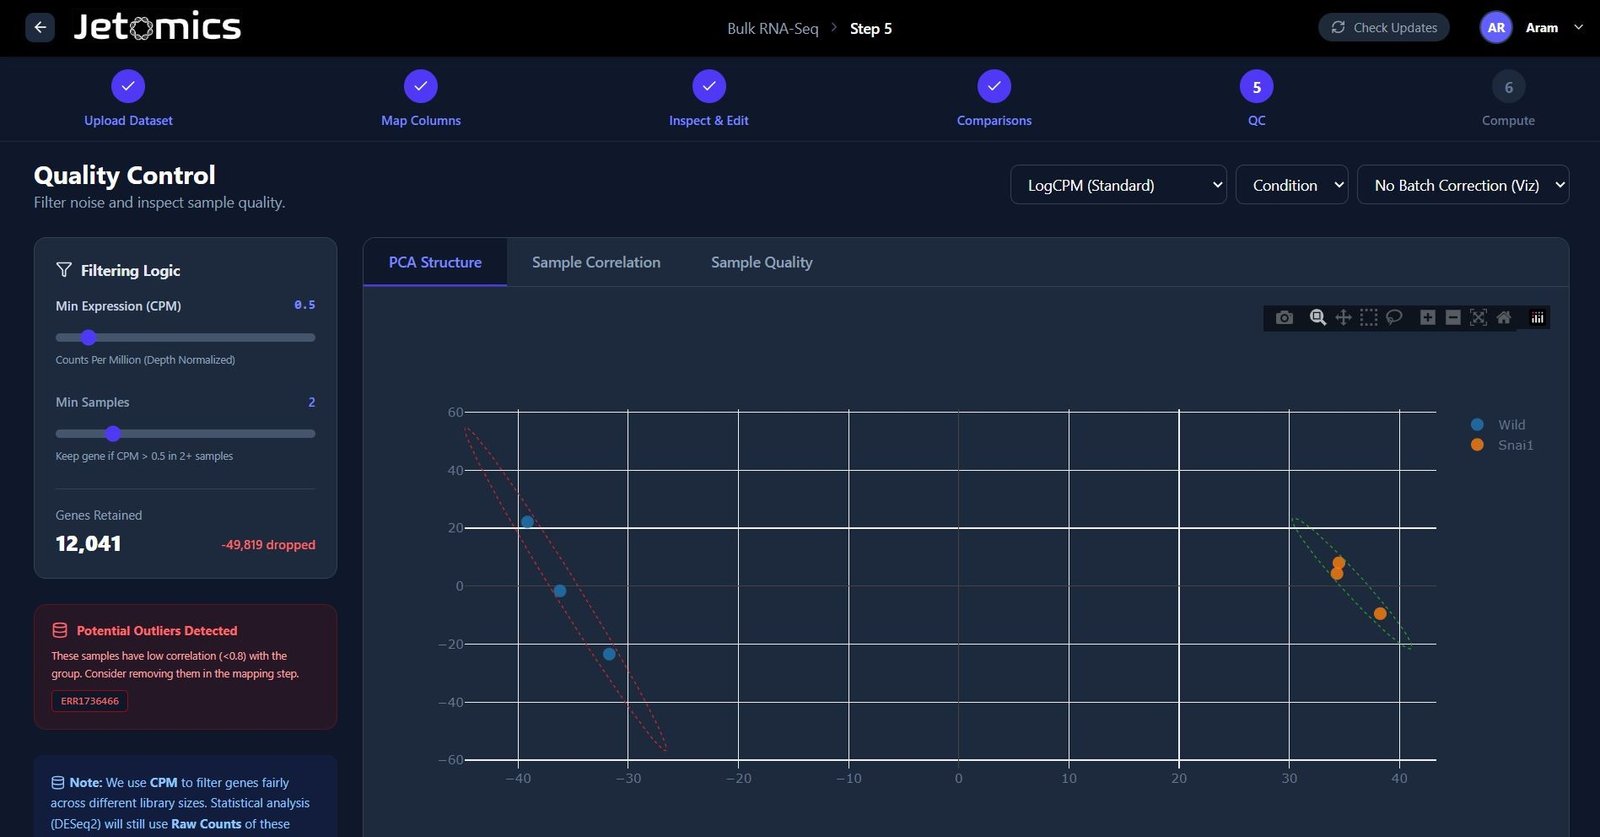
Pre-processing & QC
Instantly assess data quality before you begin.
- Automated Filtering: Remove low count genes based on Counts Per Million and Min Samples scores.
- Normalization: One-click LogCPM, or Median of Ratios normalization.
- Batch Correction: Identify and remove batch effects with instant PCA visualization.
- Sample Quality: Identify the correlation between samples and filter out samples based on sequencing depth and library complexity.
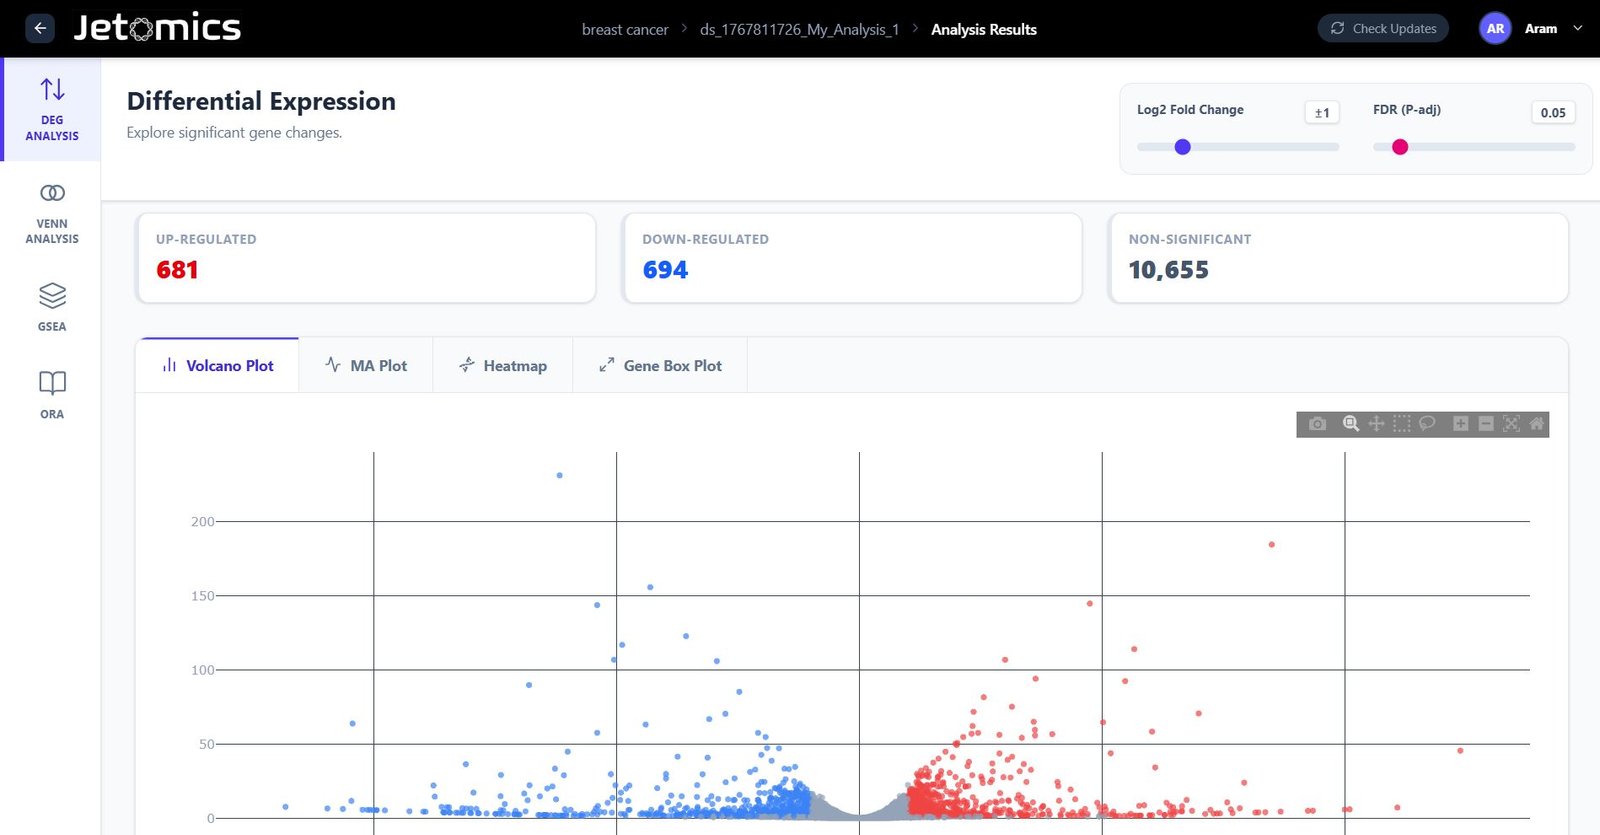
Differential Expression & Enrichment
Run industry-standard methods (DESeq2, edgeR, Limma) without writing a single line of code.
- Comparison Wizard: define complex contrasts effortlessly.
- Interactive Plots: Zoom into Volcano plots and select genes of interest.
- VENN Diagrams: Find the DEGs shared beetween up to 3 datasets, select genes of interest, and perform downstream analysis on them.
- Pathway Analysis: Integrated GSEA and ORA (GO/KEGG/TF/Cell-Types & Markers/Drugs & Diseases) enrichment.
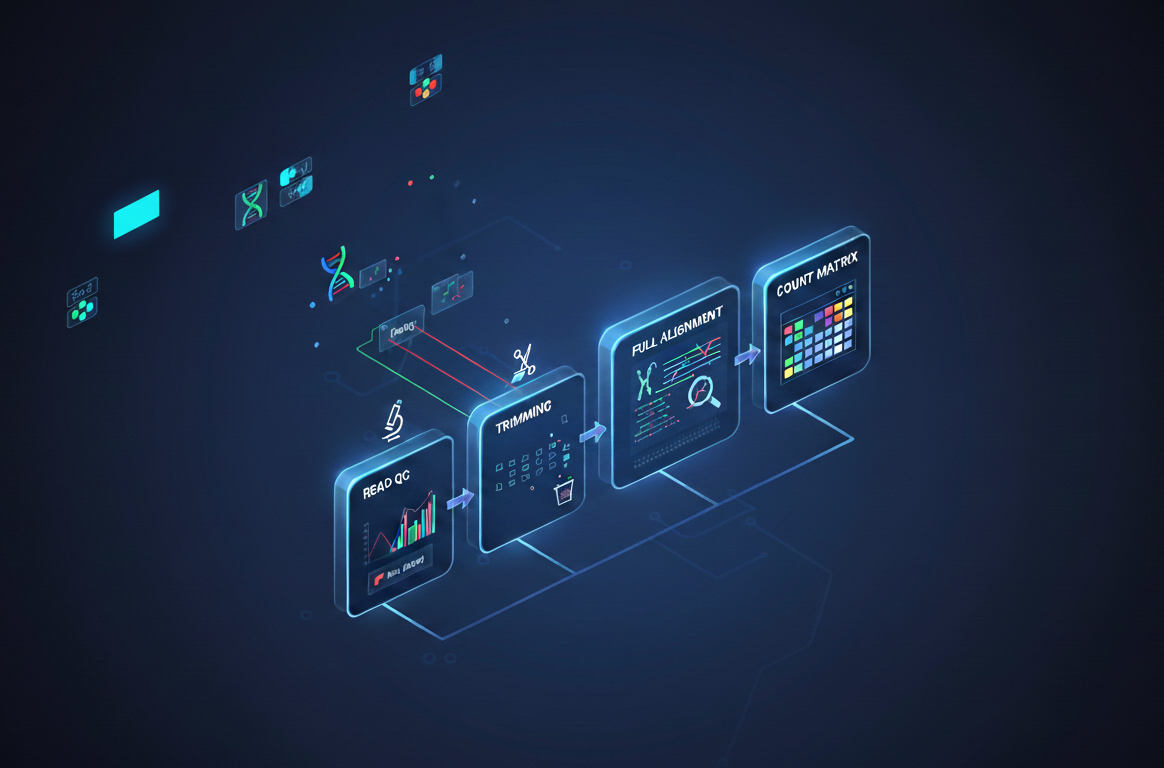
Complete FastQ Pipeline
An end-to-end solution for raw sequencing data. Go from .fastq files to count matrices without leaving the app, installing gazillions of command line tools and without writing multiple-line complicated commands.
- Read QC: Integrated FastQC for immediate quality assessment.
- Trimming: Adapter trimming and quality filtering via Trimmomatic.
- Full Alignment: Traditional alignment with HISAT2 for deep analysis.
Single-Cell Pipeline
Analyze up to 500k cells seamlessly on a standard laptop. Smart memory management meets powerful analytics.
Get your free license today.
Download the latest Jetomics beta version and claim your free license!
Download Jetomics